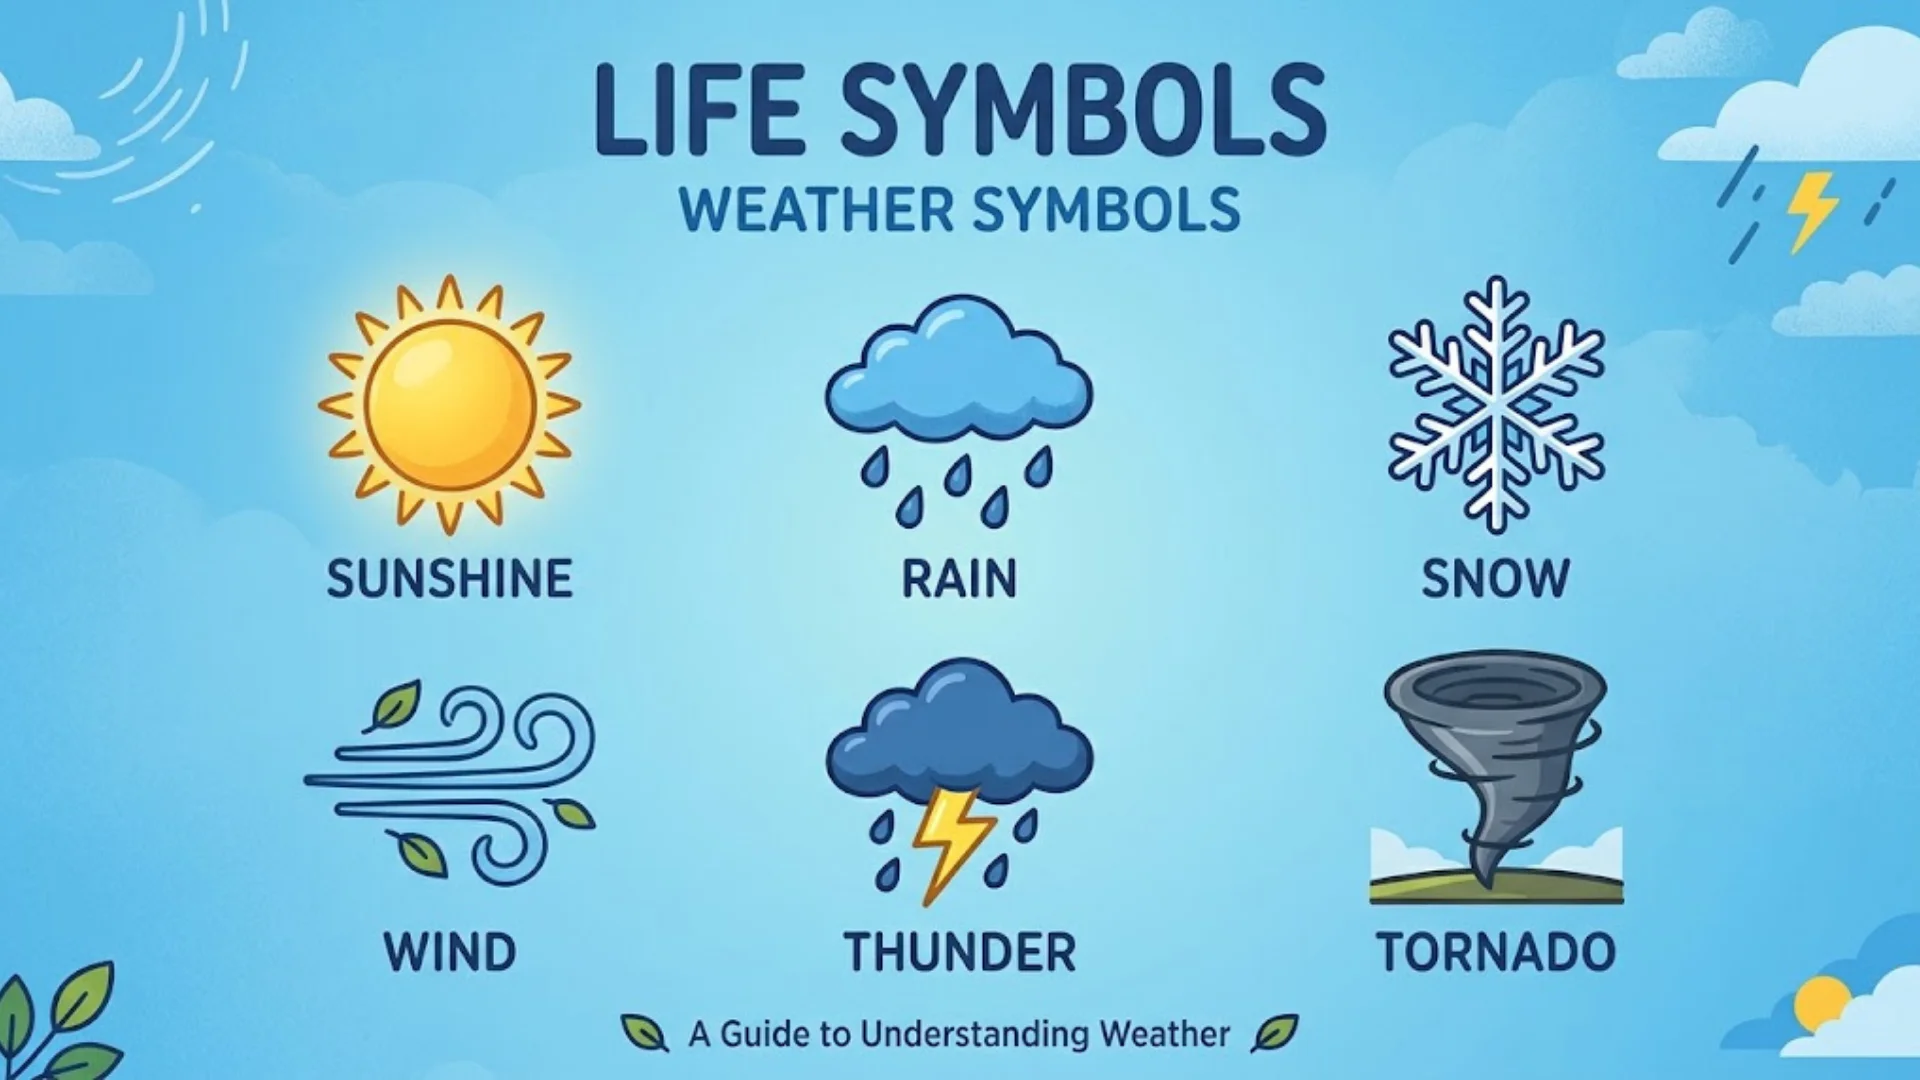
Weather symbols help you understand the forecast at a glance. A sun, cloud, raindrop, snowflake, or lightning bolt can tell you what conditions to expect without reading a long weather report. However, weather forecasts also contain important details about temperature, wind speed, rainfall probability, visibility, humidity, and air quality.
Learning weather forecast symbols and meanings makes it easier to plan your day, prepare for changing conditions, and understand warnings about severe weather. Whether you use a weather app, check the Met Office forecast, or read a weather map, knowing what each symbol represents can help you make better decisions.
This guide explains common weather symbols, shows how to interpret a weather forecast table, and describes the measurements behind the icons. It also covers wind direction, UV levels, air pollution, pollen forecasts, pressure charts, weather fronts, and long-range forecasts.
Quick answer: Weather symbols are visual indicators of expected or observed conditions, such as sunshine, clouds, rain, snow, fog, or thunderstorms. Always read them alongside the forecast’s temperature, precipitation probability, wind information, time, and legend because symbols can vary between providers.
What Are Weather Symbols?
Weather symbols are icons or markings used to communicate weather conditions in a simple visual format. Weather services use them in mobile apps, websites, television forecasts, printed charts, and meteorological reports.
A weather icon might represent the expected conditions during a particular hour, while a symbol on a pressure chart may show a cold front or a high-pressure system. Although both are weather symbols, they serve different purposes.
Common examples include:
- Sunny day symbol: Indicates sunny or mainly clear daytime conditions.
- Partly cloudy symbol: Shows a mixture of cloud and clearer sky.
- Rain symbol: Indicates expected rainfall.
- Snow symbol: Represents snowfall or snow showers.
- Thunderstorm symbol: Signals thunderstorms or thunder-related weather.
- H or L on a weather map: Marks a high-pressure or low-pressure center.
Weather Symbols vs. Weather Forecast Icons vs. Weather Chart Symbols
These terms are related, but they don’t always mean the same thing.
| Term | What it means | Example |
| Weather symbols | A broad term for visual weather indicators | Sun, cloud, rain, wind arrow |
| Weather forecast icons | Graphics showing expected conditions for a location and time | Rain showers expected this afternoon |
| Weather map symbols | Markings used to show larger weather patterns | H, L, cold front |
| Weather chart symbols | Technical markings on meteorological charts | Isobars, fronts, troughs |
Weather apps may use different designs for similar conditions. A cloud with raindrops in one app might look different in another, even when both indicate rain. Always check the legend provided by the weather service when you need an exact interpretation.
How the Met Office Forecast Uses Weather Symbols
The Met Office is the UK’s national weather service. Its forecasts use icons alongside information such as temperature, precipitation, wind, and other conditions.
A forecast icon summarizes expected weather, but it doesn’t tell you everything. A rain symbol, for example, won’t necessarily tell you how much rain will fall, how long it will last, or whether every part of the forecast area will receive rain.
To understand the full picture, read the icon together with the relevant time, temperature, rainfall probability, wind details, and any official weather warnings.
Weather Forecast Symbols and Meanings: Complete Table
The following weather forecast table explains common symbols and the conditions they represent. The descriptions follow the Met Office’s published weather-code definitions, although the appearance of an icon may differ between websites and apps.
Sunny and Cloudy Weather Symbols
| Weather symbol | Name | Meaning |
| ☾ | Clear night | The forecast expects clear or mostly clear nighttime conditions. |
| ☀️ | Sunny day | Sunny conditions are expected during the day. |
| 🌤️ | Partly cloudy | Sunshine and clouds are both expected. |
| 🌙☁️ | Partly cloudy night | Some cloud is expected, with clearer periods at night. |
| 🌤️ | Sunny intervals | Sunshine is expected between periods of cloud. |
| ☁️ | Cloudy | Much of the sky is expected to be covered by cloud. |
| ☁️☁️ | Overcast | The sky is expected to be covered almost completely by cloud. |
These are illustrative symbols, not exact copies of every Met Office icon. Use the forecast provider’s own icon legend when matching symbols precisely.
A cloudy icon doesn’t automatically mean rain. Cloud cover describes how much of the sky is obscured by clouds, while precipitation describes whether rain, snow, or another form of water is expected to fall.
Fog and Mist Weather Symbols
| Condition | What it means |
| Mist | Small water droplets reduce visibility near the ground, but conditions are generally less restrictive than dense fog. |
| Fog | Suspended water droplets significantly reduce visibility. |
| Reduced visibility | Objects farther away become harder to see because of fog, mist, precipitation, smoke, or other particles. |
Fog and mist can affect driving, aviation, and other outdoor activities. A forecast may show fog even when the temperature doesn’t appear particularly cold, because visibility also depends on moisture and local atmospheric conditions.
Rain and Drizzle Symbols
| Condition | What it means |
| Drizzle | Very small water droplets fall from low cloud. |
| Light rain | Rainfall is expected at a relatively low intensity. |
| Heavy rain | Rainfall is expected at a higher intensity. |
| Light rain shower during the day | A brief or intermittent period of light rain may occur during daylight hours. |
| Light rain shower at night | Light showers are expected during nighttime hours. |
| Heavy rain shower during the day | More intense showers may occur during the day. |
| Heavy rain shower at night | More intense showers may occur at night. |
Rain and rain showers aren’t identical. Rain can persist for an extended period, while showers often begin and end more abruptly. Showers may also affect one neighborhood while nearby areas remain dry.
A symbol alone doesn’t show the total amount of rain expected. Check the rainfall amount, precipitation probability, forecast period, and any heavy-rain warnings when these details matter.
Sleet and Hail Symbols
| Condition | What it means |
| Sleet | A mixture of rain and ice particles, or partially frozen precipitation, depending on the forecasting service’s terminology. |
| Sleet shower during the day | Intermittent sleet is expected during daylight hours. |
| Sleet shower at night | Intermittent sleet is expected overnight. |
| Hail | Ice particles form in strong clouds and fall to the ground. |
| Hail shower during the day | Hail may fall in showers during the day. |
| Hail shower at night | Hail may occur in nighttime showers. |
Sleet and hail are different forms of precipitation. Sleet commonly develops when falling precipitation encounters a layer of freezing air, while hail grows inside strong thunderstorm clouds.
Snow and Snow Shower Symbols
| Condition | What it means |
| Light snow | Snowfall is expected at a relatively low intensity. |
| Heavy snow | Snowfall is expected to be more intense. |
| Light snow shower during the day | Intermittent light snow may fall during daylight hours. |
| Light snow shower at night | Intermittent light snow may fall overnight. |
| Heavy snow shower during the day | More intense snow showers may occur during the day. |
| Heavy snow shower at night | More intense snow showers may occur at night. |
Snowfall intensity doesn’t tell you exactly how much snow will accumulate. Ground temperature, wind, elevation, and the duration of snowfall also influence the final amount.
Thunder and Thunderstorm Symbols
| Condition | What it means |
| Thunder | Thunder-related weather is reported or expected. |
| Thunderstorm | A storm involving lightning and thunder is expected or occurring. |
| Thunder shower during the day | Thunderstorms or thunder-related showers may occur during the day. |
| Thunder shower at night | Thunder-related showers may occur overnight. |
| Thunderstorm risk | The forecast indicates a possibility of thunderstorms. |
Thunderstorms can bring lightning, heavy rain, gusty winds, and sometimes hail. A thunderstorm icon doesn’t always mean severe weather, so check official warnings for information about the expected hazards.
Daytime and Nighttime Weather Forecast Icons
Daytime weather symbols and nighttime weather symbols help show the expected conditions during different parts of the day. Some forecast providers use separate icons for daytime and nighttime even when the underlying weather conditions are similar.
What Do Daytime Weather Symbols Mean?
A sun symbol usually indicates sunny conditions, while a sun behind a cloud suggests a mixture of sunshine and cloud. Rain, snow, and thunderstorm icons indicate the expected type of precipitation or storm activity.
However, an icon is a summary of the forecast rather than a minute-by-minute guarantee. The Met Office explains that its symbols represent the most likely predominant conditions for the forecast period.
What Do Nighttime Weather Symbols Mean?
A clear-night symbol generally represents clearer nighttime conditions. A moon alongside a cloud indicates cloud cover, while rain or snow symbols show the expected precipitation.
Nighttime symbols don’t indicate that the weather will remain unchanged all night. Conditions can shift as clouds, showers, and weather systems move through an area.
Sunny Intervals vs. Partly Cloudy
These descriptions are similar, but the exact meaning depends on the forecasting service.
- Sunny intervals: The forecast expects periods of sunshine separated by cloudier periods.
- Partly cloudy: The forecast expects a mixture of cloud and clearer sky.
Neither description guarantees a specific number of sunny minutes. Check the hourly forecast if the timing of sunshine or showers matters to your plans.
How to Read a Weather Forecast Table
A weather forecast table puts several types of forecast information together. It usually shows the time, weather icon, temperature, wind, and chance of precipitation.
The Met Office’s UK forecast provides hourly details for the first two days and three-hourly details for days three through seven. Available information includes weather, temperature, wind speed and direction, UV, and feels like temperature.
Understanding Weather Forecast Data
Imagine a forecast row contains these readings:
| Forecast detail | Example | How to interpret it |
| Time | 3 PM | The forecast applies to this time or period. |
| Weather icon | Cloud and rain | Rain or showers may occur. |
| Air temperature | 22°C | The forecast air temperature is 22 degrees Celsius. |
| Feels like | 20°C | Conditions may feel closer to 20°C. |
| Chance of rain | 40% | There is a 40% forecast probability under the provider’s definition. |
| Wind | SW, 15 km/h | Wind is coming from the southwest at 15 km/h. |
| Gusts | 25 km/h | Brief stronger winds may reach around 25 km/h. |
These are example values for explaining a forecast, not live weather readings.
How to Read an Hourly Weather Forecast
An hourly weather forecast helps you understand how conditions may change throughout the day. It is useful when planning a commute, an outdoor event, a walk, or travel.
Check the following details:
- The forecast time and date.
- The weather icon and any description.
- The expected temperature and feels like temperature.
- The chance of rain or snow.
- Wind speed and gusts.
- Any warnings relevant to your location.
A three-hourly weather forecast provides fewer time points. It can still be useful for planning, but a brief shower between forecast times may not appear as a separate row.
How to Read a Seven-Day Weather Forecast
A seven-day weather forecast gives you a useful overview of the week ahead. Look at each day’s expected conditions, high and low temperatures, precipitation chances, and wind.
For example, two days may both show a rain icon, but one may have a low probability of rain and another a high probability. The icons alone don’t explain that difference.
As the forecast period gets longer, uncertainty generally increases. Use the first few days for more detailed planning and treat later days as a guide to likely conditions rather than a fixed schedule.
What Is a 28-Day Weather Forecast?
A 28-day forecast provides a longer-range outlook, which may highlight broad patterns or the likelihood of warmer, colder, wetter, or drier conditions.
It usually cannot reliably tell you the exact hour it will rain on a particular date four weeks away. Small changes in atmospheric patterns can shift rainfall and temperature considerably.
| Forecast period | Best use |
| Hourly | Planning activities around short-term changes |
| Three-hourly | Reviewing conditions in broader time blocks |
| Seven-day | Planning the coming week |
| 28-day | Understanding broad weather trends and uncertainty |
Weather Forecast Temperature and Atmospheric Conditions
Temperature, humidity, and pressure help explain what the atmosphere is doing. These weather indicators provide more detail than a simple sunny or rainy icon.
Air Temperature, Maximum Temperature, and Minimum Temperature
Air temperature measures how warm or cold the air is. Forecasts commonly display it in degrees Celsius or Fahrenheit.
- Maximum daily temperature: The highest temperature expected during the forecast day.
- Minimum nighttime temperature: The lowest temperature expected, often during the night or early morning.
- Daytime temperature: The temperature expected during daylight hours.
- Temperature variation: The change in temperature over a period of time.
Celsius and Fahrenheit use different scales. To convert Celsius to Fahrenheit, multiply the Celsius value by 1.8 and add 32.
For example, 20°C equals 68°F. A temperature of 0°C equals 32°F.
What Does Feels Like Temperature Mean?
The feels like temperature estimates how warm or cold conditions may feel to a person. It can differ from the measured air temperature because of wind, humidity, sunlight, and the calculation used by the weather service.
In cold weather, wind can carry heat away from exposed skin more quickly. This effect is called wind chill. In hot weather, high humidity can reduce the effectiveness of sweat evaporation, making conditions feel more uncomfortable.
For example, a forecast might show an air temperature of 30°C but a feels like temperature of 35°C. This doesn’t mean the air itself has reached 35°C. It means the combined conditions may feel more like that temperature under the service’s calculation.
What Does 100% Humidity Mean?
Relative humidity compares the amount of water vapor in the air with the amount the air could hold at the same temperature before becoming saturated.
A reading of 100% relative humidity means the air is saturated at that temperature. It doesn’t mean that the air is made entirely of water, nor does it guarantee rainfall.
When saturated air cools, water vapor can condense into tiny droplets, producing fog or clouds. Rain still depends on other atmospheric processes that allow droplets or ice particles to grow and fall.
Humidity also affects evaporation. Water generally evaporates more readily when the surrounding air can accept more water vapor, although temperature, airflow, and the surface itself matter too.
What Does Atmospheric Pressure Mean?
Atmospheric pressure is the force exerted by the weight of the air above a location. Weather services often report pressure in hectopascals (hPa).
Pressure patterns help meteorologists understand how weather systems are developing.
- High-pressure systems are often associated with more settled conditions, although cloud, fog, and strong winds can still occur.
- Low-pressure systems are often associated with rising air, cloud formation, and unsettled weather.
- Pressure gradients show how quickly pressure changes across an area. Stronger gradients are often associated with stronger winds.
Pressure also changes with altitude because less air lies above a location at higher elevations. Weather charts often use mean sea level pressure (MSLP) to make pressure readings from different elevations easier to compare.
Wind Direction, Speed, and Gust Symbols
Wind information helps you judge whether conditions will feel calm, breezy, or potentially hazardous. A forecast may show a direction letter, an arrow, an average speed, and a separate gust speed.
How to Read Wind Direction Arrows
Wind direction tells you where the wind comes from, not where it is going.
| Direction | Abbreviation | Meaning |
| North | N | Wind comes from the north. |
| South | S | Wind comes from the south. |
| East | E | Wind comes from the east. |
| West | W | Wind comes from the west. |
| North-northwest | NNW | Wind comes from the direction between north and northwest. |
| South-southwest | SSW | Wind comes from the direction between south and southwest. |
A sixteen-point compass rose divides the compass into 16 main directions. These include N, NNE, NE, ENE, E, ESE, SE, SSE, S, SSW, SW, WSW, W, WNW, NW, and NNW.
A southerly wind comes from the south and moves generally toward the north. An NNW wind comes from the north-northwest and moves generally toward the south-southeast.
Wind Speed, Average Speed, and Gusts
Wind speed describes how fast the air is moving. Forecasts may display it in kilometres per hour (km/h), miles per hour (mph), metres per second (m/s), or knots.
A wind gust is a brief increase in wind speed. Gusts can be considerably stronger than the average wind and may affect cycling, driving high-sided vehicles, boating, and outdoor work.
For example, an average wind speed of 20 km/h with gusts of 40 km/h means the wind may briefly reach twice the average speed.
When reviewing wind information, check:
- Average wind speed.
- Maximum expected gusts.
- Wind direction.
- The period covered by the forecast.
- Official strong-wind warnings.
What Is the Beaufort Wind Scale?
The Beaufort scale describes wind strength using categories based on observed effects at sea and on land. It ranges from Force 0, calm, to Force 12, hurricane-force winds.
It provides a useful descriptive scale, but it isn’t a replacement for the numerical wind speed or official warnings. Wind speeds associated with each force are approximate ranges, and impacts depend on exposure, terrain, and local conditions.
Weather Visibility Codes and Humidity Levels
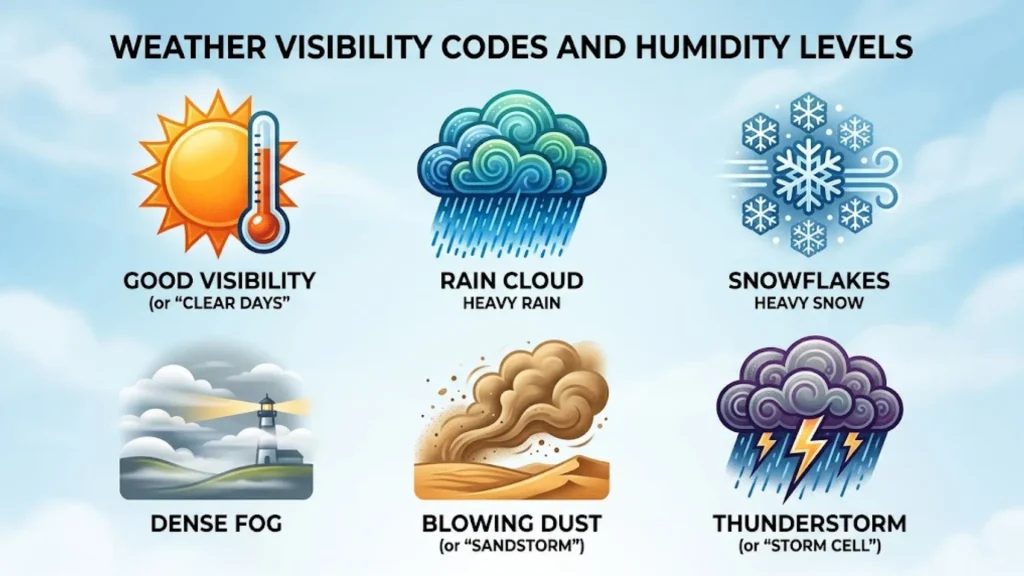
Visibility measures how far a person can see through the atmosphere under prevailing conditions. Fog, mist, heavy rain, snow, smoke, and airborne particles can all reduce visibility.
What Is the Visibility Index?
Some forecasts provide visibility in meters or kilometers. Others use category labels or codes.
The Met Office’s published weather-code guide uses these visibility abbreviations and ranges:
Definition of Codes
| Code | Category | Visibility range |
| VP | Very poor | Less than 1 km |
| P | Poor | 1–4 km |
| M | Moderate | 4–10 km |
| G | Good | 10–20 km |
| VG | Very good | 20–40 km |
| E | Excellent | More than 40 km |
These are specific to that coding system. Other providers may use different thresholds or different codes, so check the relevant legend before applying them to another forecast.
How Visibility and Humidity Affect Weather Conditions
High humidity can contribute to fog when air near the ground becomes saturated and water vapor condenses into droplets. However, high humidity alone doesn’t guarantee fog.
Visibility can also fall during heavy rain, snow, dust events, or smoke episodes. If visibility is poor, allow extra travel time and follow local safety advice.
UV Index Symbols and Sun Safety
The UV index measures the strength of ultraviolet radiation from the sun at Earth’s surface. UV exposure can damage skin and eyes, even when the weather is cool or the sky is partly cloudy.
What Do UV Index Numbers Mean?
The World Health Organization uses these standard UV categories:
| UV index | Category | General advice |
| 0–2 | Low | Sun protection is generally less important for most people, although individual needs vary. |
| 3–5 | Moderate | Consider shade, protective clothing, and sunscreen. |
| 6–7 | High | Take protective measures, especially around midday. |
| 8–10 | Very high | Minimize unprotected exposure and use strong sun protection. |
| 11+ | Extreme | Avoid prolonged unprotected exposure and seek shade whenever possible. |
The UV index reflects the intensity of ultraviolet radiation, not the air temperature. The Met Office explains that UV levels depend on factors including the sun’s angle, cloud cover, atmospheric particles, and ozone.
How to Use the UV Index for Sun Protection
When the UV index is elevated:
- Seek shade, particularly around the middle of the day.
- Wear protective clothing and a broad-brimmed hat.
- Use broad-spectrum sunscreen and reapply it according to the product instructions.
- Protect your eyes with suitable sunglasses.
- Remember that clouds don’t always block all harmful UV radiation.
The safest approach depends on the UV forecast and your circumstances. A low air temperature doesn’t mean UV exposure is low.
How Are Sunrise and Sunset Times Calculated?
Sunrise and sunset times estimate when the sun’s upper edge appears above or disappears below the horizon. Calculations account for the date, location, Earth’s rotation, and the sun’s apparent position. Standard calculations also account for atmospheric refraction.
Times differ by location and change through the year because of Earth’s axial tilt and orbit. Altitude and local terrain can also affect when you actually see the sun.
If a forecast shows sunrise at 6:30 AM, that time applies to the location and date selected. It shouldn’t be assumed to apply to a nearby location in another time zone or at a substantially different longitude.
Air Pollution Forecast Symbols and Air Quality Levels
Weather services may show air pollution levels alongside ordinary weather conditions. Air quality forecasts estimate the concentration of pollutants in the atmosphere and help people understand when outdoor exposure may pose a greater health risk.
What Do Air Pollution Forecast Symbols Mean?
The Met Office presents UK regional air pollution information using categories such as these:
| Forecast category | Meaning |
| No significant pollution | Pollution levels are not expected to be significant under the service’s classification. |
| Low | Pollution levels are relatively low. |
| Moderate | Pollution levels are higher and may matter more to some sensitive people. |
| High | Pollution may pose a greater health concern, particularly for sensitive groups. |
| Very high | Pollution levels are elevated, and following health advice is especially important. |
| No data | The service doesn’t have an available reading or forecast for the relevant information. |
These labels belong to the relevant forecast system. Other countries use different air quality indexes and category thresholds, so don’t assume that every service uses the same scale.
Common Air Pollutants in Weather and Air Quality Reports
Air quality information may cover several pollutants:
- Sulphur dioxide (SO₂): A gas produced by some industrial processes and the burning of sulfur-containing fuels.
- Nitrogen oxides (NOₓ): Gases associated with combustion, including vehicle engines and some industrial sources.
- Particulate matter (PM): Tiny airborne particles that can enter the respiratory system. PM2.5 and PM10 describe particles by their approximate aerodynamic diameter.
- Ground-level ozone: A pollutant that forms through chemical reactions involving other pollutants and sunlight.
Pollution levels can change with traffic, industrial emissions, wind, temperature, and atmospheric mixing. Regional forecasts may not capture every local hotspot, so follow local health guidance when pollution is a concern.
Pollen Forecast Symbols and Pollen Levels
A pollen forecast estimates how much pollen is expected in the air across a region. It can help people with seasonal allergies plan outdoor activities and take steps to reduce exposure.
What Do Pollen Forecast Symbols Mean?
The Met Office uses regional pollen categories including the following:
| Category | Meaning |
| No significant pollen | Pollen levels are not expected to be significant under the forecast’s classification. |
| Low | Relatively low pollen levels are expected. |
| Moderate | Pollen levels are expected to be higher than low levels. |
| High | Higher pollen exposure is expected. |
| Very high | Pollen exposure is expected to be particularly high. |
| No data | Pollen information isn’t available for the forecast period or region. |
A pollen forecast is generally regional, not a direct measurement at your exact address. Actual pollen exposure may vary with local vegetation, wind, rainfall, and nearby sources of pollen.
How to Use a Pollen Forecast
If pollen affects you, consider these practical steps:
- Check the forecast for your region before spending long periods outdoors.
- Follow your clinician’s advice about allergy treatments.
- Change clothes and shower after outdoor activities if pollen exposure triggers symptoms.
- Keep windows closed when pollen levels are high, if practical and comfortable.
- Remember that pollen types and peak seasons differ by region.
Pollen levels are not the same as air pollution levels. They measure different things, even though both can affect how comfortable outdoor conditions feel.
Weather Map Symbols and Their Meanings
Unlike everyday forecast icons, weather map symbols help explain the large-scale patterns that influence local weather. Meteorologists use them to analyze pressure, air masses, fronts, and likely areas of cloud or precipitation.
High-Pressure and Low-Pressure Symbols
On many weather charts, H marks a high-pressure center and L marks a low-pressure center.
- High pressure: Air tends to descend over the center of many high-pressure systems. This can limit cloud development and support settled weather, although fog, low cloud, and strong winds can still occur.
- Low pressure: Air often rises in parts of a low-pressure system. Rising air can cool and form clouds, sometimes leading to rain or snow.
These are broad patterns, not guarantees. A high-pressure system doesn’t always mean clear skies, and a low-pressure system doesn’t always produce rain at every location.
What Are Isobars on a Weather Map?
Isobars are lines joining places with the same atmospheric pressure, usually adjusted to mean sea level on surface weather charts.
The spacing between isobars helps show the pressure gradient:
- Closely spaced isobars usually indicate a stronger pressure gradient and often stronger winds.
- Widely spaced isobars usually indicate a weaker pressure gradient and often lighter winds.
Wind is also affected by Earth’s rotation, friction, and the local terrain, so isobar spacing is only one part of the picture.
Cold Front, Warm Front, and Other Weather Front Symbols
A weather front is a boundary or transition zone between air masses with different properties, such as temperature and humidity.
| Front | Common chart appearance | General meaning |
| Cold front | A line with triangles | Colder air is advancing into warmer air. |
| Warm front | A line with semicircles | Warmer air is advancing over cooler air. |
| Stationary front | Alternating triangles and semicircles on opposite sides | The boundary is moving slowly or has little net movement. |
| Occluded front | Triangles and semicircles on the same side | A cold front has caught up with a warm front, lifting the warm air away from the surface. |
The symbols’ colors and exact styles vary by chart. Developing, weakening, and upper-level fronts may appear on specialist charts, but not every public forecast displays them.
How Weather Fronts Affect Precipitation
Weather fronts can help create clouds and precipitation by lifting air. The type and intensity of precipitation depend on moisture, atmospheric stability, temperature, and how the front interacts with the surrounding air masses.
A warm front may be associated with widespread cloud and prolonged precipitation. A cold front can bring showers, a band of rain, a wind shift, or thunderstorms if conditions support them. These are common patterns rather than rules for every front.
What Is a Trough in Meteorology?
A trough is an elongated area of relatively low atmospheric pressure or lower geopotential height on a weather chart. Troughs can encourage air to rise and may support cloud formation and unsettled conditions.
A surface trough, an upper trough, and a thickness trough describe different features. Their meaning depends on the chart being used and the atmospheric level being analyzed.
What Is a Convergence Line in Weather?
A convergence line is an area where air flows together near the surface. When air converges, some of it may be forced upward. If the air is moist and unstable enough, clouds and showers can develop.
A sea-breeze convergence line is one example. Different airflows associated with land and sea heating can meet inland and trigger localized showers or thunderstorms.
What Are Thickness Lines on a Weather Map?
Thickness lines represent the vertical distance between two specified pressure levels in the atmosphere. Because warm air expands and cold air contracts, the thickness of an atmospheric layer is related to its average temperature.
Meteorologists use thickness patterns to help assess broad temperature structures and weather systems. A thickness trough can indicate a region of relatively lower thickness, but it must be interpreted alongside pressure patterns and other chart features.
What Are Frontogenesis and Frontolysis?
These technical terms describe changes in a weather front:
- Frontogenesis: The formation or strengthening of a front as the contrast in air-mass properties becomes more pronounced.
- Frontolysis: The weakening or dissipation of a front as that contrast decreases.
These terms are mainly useful for understanding specialist weather analysis. Most people don’t need them to interpret everyday forecast icons.
How Accurate Are Weather Forecasts?
Weather forecasts use observations, mathematical models, and meteorological analysis to estimate future conditions. They are useful planning tools, but they can’t predict every local change with certainty.
How Weather Forecasts Are Updated
Weather services collect information from sources such as weather stations, satellites, radar, weather balloons, ships, and aircraft. Forecast models use these observations to estimate how the atmosphere may change.
Forecasts can change when new observations arrive or when models produce a different estimate of a weather system’s movement.
The Met Office explains that location-specific forecasts account for surrounding hours when determining the predominant weather symbol for a given time. This helps avoid treating every small variation as a separate forecast condition.
Why Forecast Accuracy Changes Over Time
Forecast accuracy depends on the type of weather, the location, the forecast period, and the detail being predicted.
- Short-range forecasts: Usually provide more useful detail about expected conditions in the next few hours or days.
- Seven-day forecasts: Help with weekly planning, but the timing and location of rain may change.
- 28-day forecasts: Are better suited to broad trends than precise daily predictions.
A forecast for widespread rain may be more dependable than one predicting the exact location of an isolated thunderstorm. Small weather systems can develop or change direction quickly.
How to Get Reliable Weather Information
For a more useful interpretation of weather forecast data:
- Check the forecast’s date, time, and location.
- Read the weather icon alongside precipitation probability and wind information.
- Check official warnings when severe weather is possible.
- Review updated forecasts before important outdoor plans.
- Use the provider’s symbol legend rather than assuming all apps use identical icons.
- Treat long-range outlooks as guidance, not guarantees.
Frequently Asked Questions About Weather Symbols
What Do Weather Forecast Symbols Mean?
Weather forecast symbols represent expected conditions such as sunshine, cloud, rain, snow, fog, or thunderstorms. Their precise appearance and meaning can vary between providers, so check the legend when necessary.
How Do You Read a Weather Forecast Table?
Start with the date and time, then check the weather icon, temperature, chance of precipitation, wind speed, and wind direction. Also review feels like temperature and official warnings when relevant.
What Is the Difference Between Rain and Rain Showers?
Rain may continue for a relatively long period, while showers tend to be more intermittent and localized. The exact distinction depends on the weather situation and the forecast provider’s terminology.
What Does the Percentage Chance of Rain Mean?
The probability of precipitation estimates the likelihood of measurable precipitation at a specified location during a defined period. A 40% chance doesn’t mean it will rain for 40% of the day or across 40% of the forecast area.
How Is the Chance of Precipitation Calculated?
Forecasters use weather observations, forecast models, and estimates of uncertainty to assess the likelihood of precipitation. The exact method depends on the forecasting system, and the percentage applies to a particular location and time period.
What Does Feels Like Temperature Mean?
Feels like temperature estimates how warm or cold conditions may feel after considering factors such as wind and humidity. It can differ from the measured air temperature.
What Does S Mean on a Weather Forecast?
On a wind-direction forecast, S means south. A southerly wind comes from the south and moves generally toward the north.
What Does NNW Mean in Wind Direction?
NNW means north-northwest. It indicates that the wind comes from the direction between north and northwest.
What Is the Beaufort Wind Scale?
The Beaufort scale classifies wind strength from Force 0, calm, to Force 12, hurricane-force winds. It uses descriptive categories based on the effects of wind rather than relying only on a numerical speed.
What Does 100% Humidity Mean?
It means the air has reached 100% relative humidity and is saturated at its current temperature. It doesn’t automatically mean rain will occur.
What Do UV Index Numbers Mean?
UV index numbers indicate the strength of ultraviolet radiation at the surface. The standard categories are low (0–2), moderate (3–5), high (6–7), very high (8–10), and extreme (11 or above).
What Does H Mean on a Pressure Chart?
H marks a high-pressure center. High pressure is often associated with settled weather, but cloud, fog, and windy conditions can still occur.
What Does L Mean on a Pressure Chart?
L marks a low-pressure center. Low-pressure systems often support rising air and cloud development, which can lead to rain or snow when sufficient moisture is present.
What Are Isobars on a Weather Map?
Isobars are lines joining places with equal atmospheric pressure. Closely spaced isobars often indicate a stronger pressure gradient and stronger winds.
What Is a Trough in Meteorology?
A trough is an elongated region of relatively low pressure or lower geopotential height. Depending on atmospheric conditions, it can help support cloud development, showers, or thunderstorms.
What Is the Difference Between Frontogenesis and Frontolysis?
Frontogenesis describes the formation or strengthening of a weather front. Frontolysis describes the weakening or dissipation of a front.
What Is the Difference Between a Seven-Day and 28-Day Forecast?
A seven-day forecast generally provides more detailed information about expected daily conditions. A 28-day forecast offers a broader outlook, but it is less reliable for predicting exact daily temperatures, rainfall, or storm timing.
Conclusion: Understanding Weather Symbols and Forecast Data
Understanding weather symbols and meanings helps you read forecasts more confidently. Common icons show sunshine, cloud cover, rain, snow, fog, and thunderstorms, while other indicators explain temperature, wind, humidity, visibility, UV exposure, air quality, and pollen levels.
For the best interpretation, don’t rely on an icon alone. Check the forecast time, precipitation probability, wind speed, feels like temperature, and relevant warnings. If you’re reading a technical weather map, learn how pressure systems, isobars, fronts, troughs, and convergence lines describe larger atmospheric patterns.
Most importantly, remember that symbols summarize the forecast rather than guarantee exact conditions. Use them alongside the provider’s explanations and updated weather information to make better decisions about travel, outdoor activities, and everyday plans.

Hello, I’m Rowan Sinclair, a passionate writer and lifelong admirer of the wisdom found in great quotes. I believe that words have the ability to inspire change, spark creativity, and connect people across cultures and generations.
I enjoy writing about motivational quotes, famous sayings, and lessons from history’s most influential thinkers. Every article I create is driven by my desire to help readers discover meaningful insights that they can apply to their own lives.
When I’m not writing, I spend my time reading biographies, exploring classic literature, and collecting memorable quotes that deserve to be shared with the world.
I am the author of Voices That Inspire and A Collection of Timeless Thoughts, two books that celebrate the enduring power of words and the stories behind them.
 Asher Monroe
 Sienna Brooks