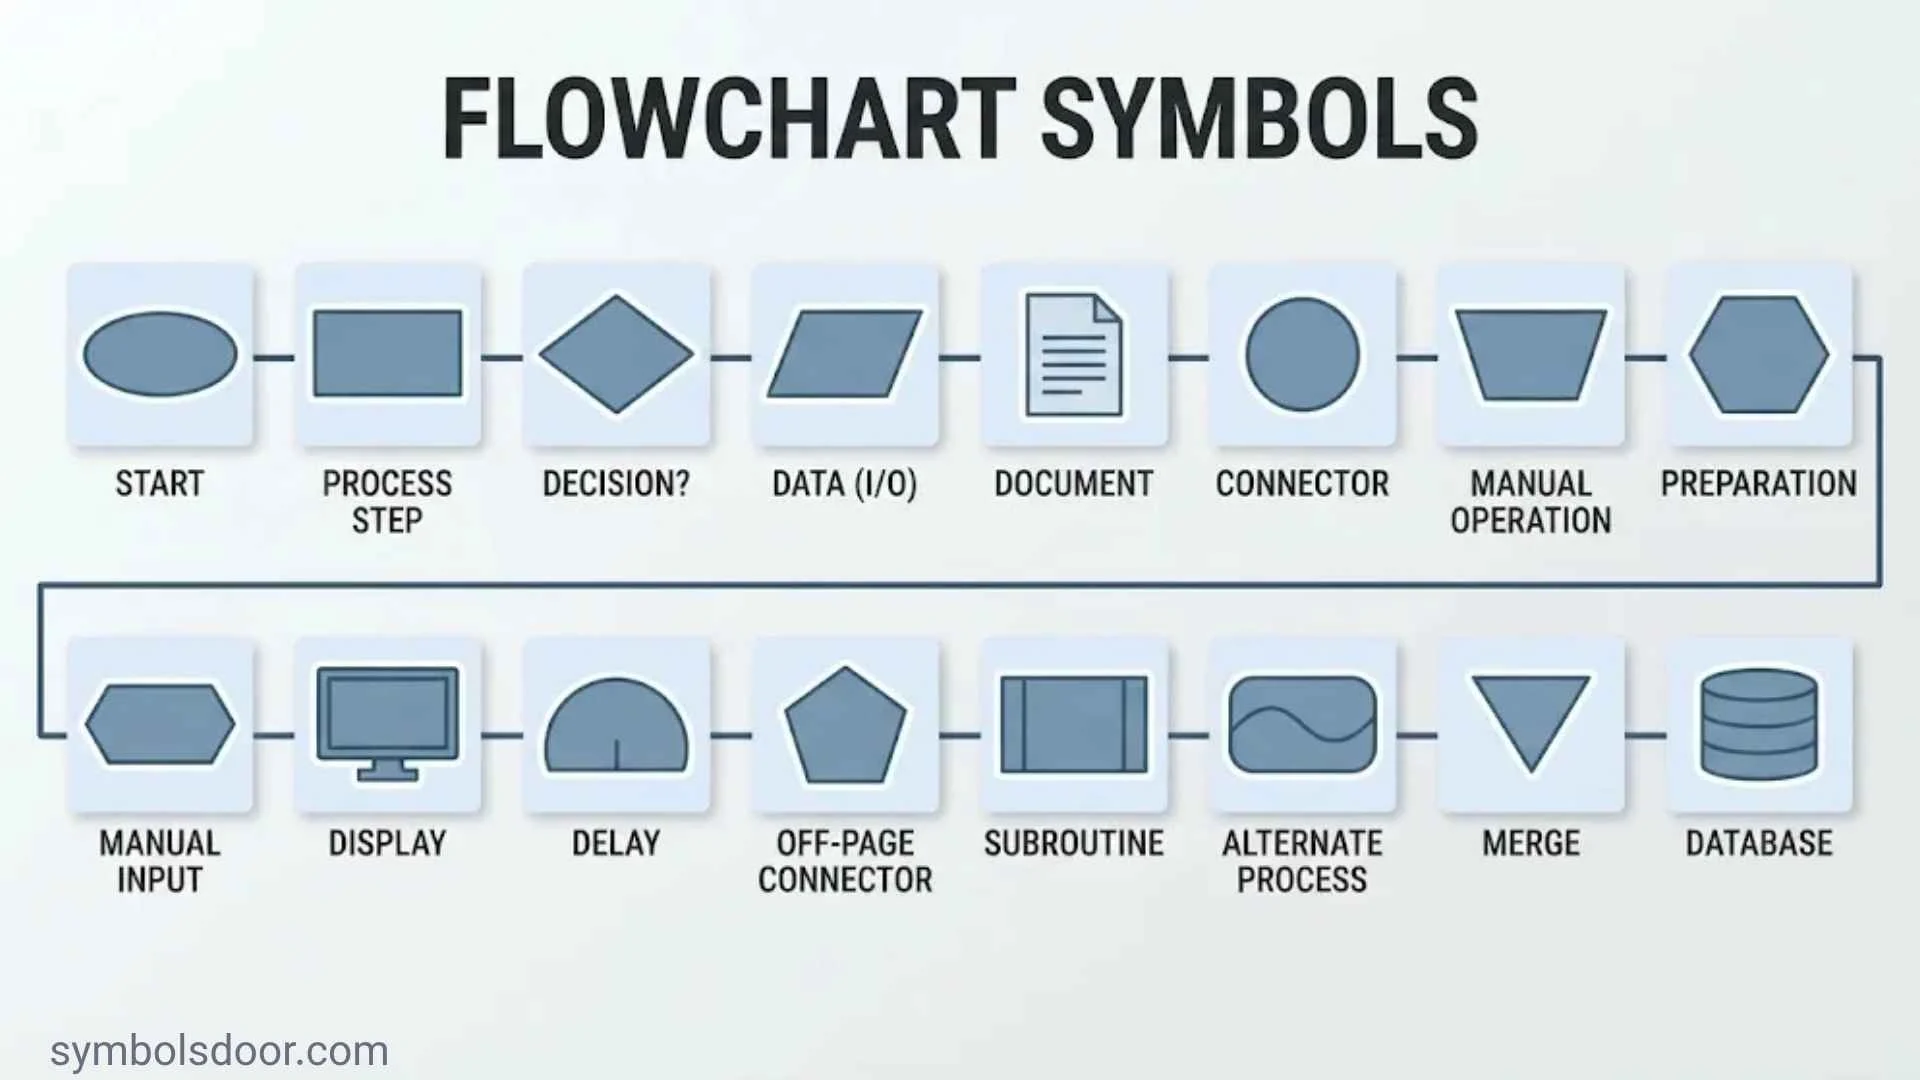
Flowchart symbols make complicated processes easier to understand. Instead of describing every action in long paragraphs, you can use familiar shapes, arrows, and labels to show exactly how a process works. A rectangle represents an action, a diamond shows a decision, and an oval marks the beginning or end.
However, these are only a few of the symbols used in flowchart diagrams. Other shapes represent documents, data storage, manual operations, waiting periods, subprocesses, and parallel activities. Knowing what each shape means helps you read diagrams correctly and create your own without confusing the people who use them.
This guide explains 30 flowchart symbol meanings, including basic and advanced shapes, their functions, and practical examples. You’ll also learn how to read a flowchart, choose the right symbols, follow common standards, and avoid mistakes when designing a process diagram.
What Are Flowchart Symbols?
Flowchart symbols are graphical shapes that represent individual steps, actions, decisions, inputs, outputs, and connections within a process. Each shape communicates a particular type of activity or relationship.
For example, imagine an online shopping process. A customer selects a product, enters shipping information, makes a payment, and receives an order confirmation. A flowchart can show every step using rectangles, parallelograms, diamonds, and arrows.
These shapes form a visual language. Someone who understands the basic flowchart notation can follow a process without reading a lengthy explanation.
A typical flowchart includes:
- Terminator symbols to identify starting and ending points.
- Process symbols to represent actions and operations.
- Decision symbols to show questions and conditional paths.
- Input/output symbols to represent information entering or leaving a system.
- Flowlines to show the direction of the process.
- Connector symbols to link different parts of a diagram.
What Is a Flowchart?
A flowchart is a graphical representation of a process. It displays activities in a logical sequence and shows how one step leads to another.
People use flowcharts to document procedures, explain algorithms, analyze business operations, and understand how information moves through a system.
A flowchart usually follows a clear direction, such as top-to-bottom or left-to-right. Arrows connect the shapes and guide readers through the process.
Why Are Flowchart Symbols Important?
The correct symbols make a diagram easier to understand. They also help teams identify problems that might remain hidden in written instructions.
For example, a decision diamond can reveal where a process splits into different outcomes. A delay symbol can highlight waiting time. A document symbol can show where someone creates or receives paperwork.
Flowchart symbols help you:
- Understand complicated processes quickly.
- Identify unnecessary steps and repeated tasks.
- Explain responsibilities and decision points.
- Document manual and automated workflows.
- Improve communication between departments.
- Support process mapping and process improvement.
- Explain software logic and algorithms.
- Identify delays, bottlenecks, and missing actions.
A well-designed flowchart doesn’t need dozens of shapes. A small group of familiar symbols can explain most everyday processes.
Basic Flowchart Symbols and Their Meanings
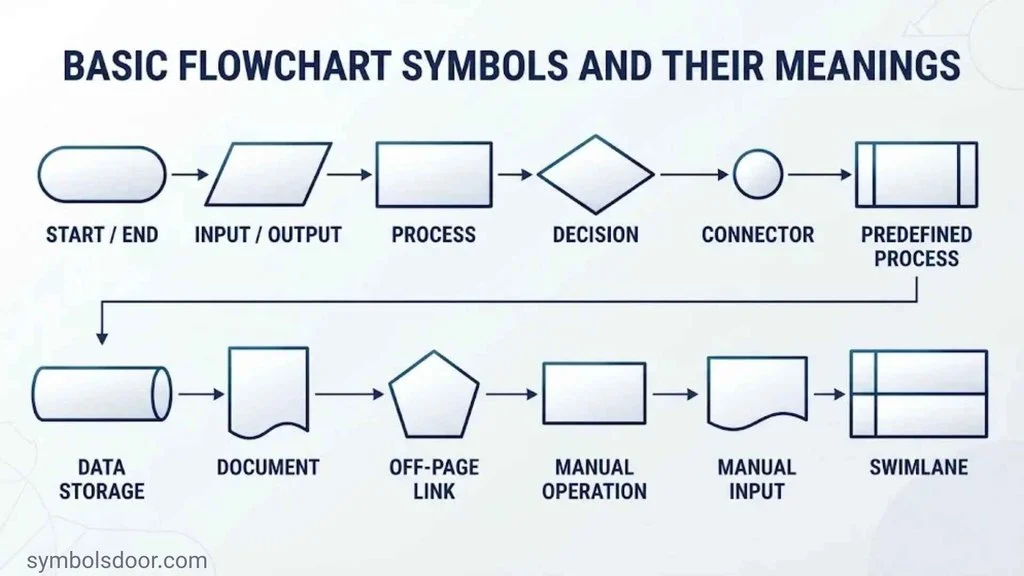
Basic symbols form the foundation of almost every process diagram. Most simple flowcharts use a terminator, process rectangle, decision diamond, input/output parallelogram, and flowline.
The following sections explain these common flowchart symbols and show when to use them.
Terminator Symbol – Oval or Rounded Rectangle
<ins>Shape:</ins> Oval, ellipse, or rounded rectangle.
<ins>Meaning:</ins> Marks the beginning or end of a process.
The terminator symbol identifies the starting and ending points of a flowchart. You may also see it called the terminal symbol, start symbol, or end symbol.
Most terminators contain short labels such as:
- Start
- Begin
- End
- Finish
- Process complete
For example, an online registration flowchart begins with a Start terminator. After the user completes registration and receives confirmation, the diagram reaches an End terminator.
A process may have more than one ending point. A payment flowchart, for instance, could finish with either Payment Approved or Payment Declined.
When to use it: Use an oval or rounded rectangle when you need to show where a process begins or finishes. Don’t use it for ordinary actions.
Process Symbol Rectangle
<ins>Shape:</ins> Rectangle.
<ins>Meaning:</ins> Represents an action, operation, or processing step.
The process symbol is one of the most recognizable flowchart shapes. It shows work that someone or something performs during a process.
Examples include:
- Calculate the total price.
- Verify customer information.
- Update an account.
- Print an invoice.
- Check inventory.
- Send an email.
A rectangle should contain a short description of the action. Start with an action verb whenever possible.
For example, “Customer Information” is less specific than “Verify Customer Information.” The second label tells readers exactly what happens.
When to use it: Use a process rectangle for ordinary tasks, calculations, system operations, and other actions that move a process forward.
Decision Symbol Diamond
<ins>Shape:</ins> Diamond.
<ins>Meaning:</ins> Represents a question or condition that determines the next step.
The decision symbol shows where a process can follow different paths. It usually contains a question that requires an answer.
For example:
- Is the payment approved?
- Is the password correct?
- Is the application complete?
- Is the product available?
A decision diamond normally has two outgoing paths, such as Yes and No. However, it can have more than two outcomes when the process requires them.
Consider a login process. The system checks the entered password. If it matches, the user enters the account. If it doesn’t, the system displays an error message.
Always label decision branches clearly. Without labels, readers may not understand which direction represents each outcome.
When to use it: Use a diamond whenever a condition changes what happens next.
Input/Output Symbol Parallelogram
<ins>Shape:</ins> Parallelogram.
<ins>Meaning:</ins> Represents information entering or leaving a process.
The input/output symbol shows how data moves into or out of a system. It is sometimes called the data symbol.
Examples of input include:
- Enter a username.
- Submit a registration form.
- Receive an order.
- Enter a product quantity.
- Upload a document.
Examples of output include:
- Display a confirmation message.
- Show the calculated total.
- Generate a result.
- Send a notification.
For instance, a calculator flowchart can use a parallelogram for “Enter Two Numbers.” After processing, another parallelogram can display “Show Sum.”
When to use it: Use this shape when information enters a process or when the process produces information as an output.
Flowline Symbol Arrow
<ins>Shape:</ins> Line with an arrowhead.
<ins>Meaning:</ins> Shows the direction and sequence of a process.
A flowline symbol connects flowchart shapes and indicates which step follows another. The arrowhead tells readers where the process moves next.
Without flowlines, a collection of shapes would not communicate a clear sequence.
For example:
Start → Enter Details → Verify Information → Display Result → End
Flowlines can move vertically or horizontally. Use a consistent direction whenever possible, and avoid unnecessary line crossings.
When to use it: Use arrows to connect steps and show the direction of process flow.
On-Page Connector Symbol Circle
<ins>Shape:</ins> Small circle.
<ins>Meaning:</ins> Connects separated parts of the same flowchart page.
An on-page connector helps you avoid long arrows that cross other shapes. It uses matching labels to show where a process continues.
For example, a circle marked A may appear at the end of one section. Another circle marked A identifies the continuation point elsewhere on the same page.
Connectors are particularly helpful in large diagrams with many branches.
When to use it: Use a labeled circle when two parts of the same page need a connection that would otherwise make the diagram difficult to read.
Off-Page Connector Symbol Pentagon
<ins>Shape:</ins> Pentagon, often resembling a home plate.
<ins>Meaning:</ins> Shows that the process continues on another page.
An off-page connector is useful when a flowchart becomes too large to fit comfortably on one page.
It usually contains a page reference or matching label. This tells readers where to find the next section.
For example, a customer application flowchart may use an off-page connector to direct readers to a separate payment verification diagram.
When to use it: Use this symbol when a process continues on another page or diagram. Include a clear reference so readers can locate the continuation.
Predefined Process Symbol – Subprocess
<ins>Shape:</ins> Rectangle with two additional vertical lines near its sides.
<ins>Meaning:</ins> Represents a process defined elsewhere.
The predefined process symbol, also known as a subprocess symbol, represents a group of actions that has its own detailed procedure.
Instead of displaying every internal step, you can use one symbol and refer readers to the separate process.
Examples include:
- Validate Customer
- Process Payment
- Calculate Tax
- Verify Identity
- Generate Monthly Report
Suppose a company uses the same customer verification procedure in several departments. A predefined process symbol lets each department reference that procedure without repeating the entire sequence.
When to use it: Use this shape when a process contains a reusable or separately documented procedure.
Document Symbol
<ins>Shape:</ins> Rectangle with a wavy lower edge.
<ins>Meaning:</ins> Represents a document or report.
The document symbol shows a physical or electronic document that a process uses or produces.
Examples include:
- Invoice
- Application form
- Contract
- Printed report
- PDF document
- Spreadsheet
For example, an order processing flowchart may use a document symbol to represent an invoice generated after payment approval.
When to use it: Use this symbol when the document itself matters to the process, rather than treating it as an ordinary action.
Multiple Documents Symbol
<ins>Shape:</ins> Two or more overlapping document symbols.
<ins>Meaning:</ins> Represents a collection of documents.
The multi-document symbol is similar to the standard document shape, but it shows several documents instead of one.
For example, an employee onboarding process may generate an employment contract, tax form, and company policy document. A multiple-documents symbol can represent that group.
When to use it: Use it when a process produces, receives, or handles multiple documents together.
Preparation Symbol Hexagon
<ins>Shape:</ins> Hexagon.
<ins>Meaning:</ins> Represents preparation, setup, or initialization.
The preparation symbol identifies an activity that gets a system or process ready for the next steps.
Examples include:
- Initialize variables.
- Configure system settings.
- Prepare equipment.
- Set a starting value.
- Load required resources.
In a software algorithm, preparation may involve setting a counter to zero before a loop begins.
When to use it: Use a hexagon when a setup or initialization activity needs to be shown separately from ordinary processing.
Manual Input Symbol Trapezoid
<ins>Shape:</ins> Quadrilateral with a slanted top edge.
<ins>Meaning:</ins> Represents information entered manually.
The manual input symbol shows that a person supplies information to a system. This often happens through a keyboard, form, or another input method.
Examples include:
- Enter customer name.
- Type a password.
- Enter an invoice number.
- Fill out an application.
- Submit a product quantity.
This symbol is especially useful in software and business process diagrams because it separates human data entry from automated system operations.
When to use it: Use it when a person manually enters information into a process.
Manual Operation Symbol Trapezoid
<ins>Shape:</ins> Trapezoid, commonly shown with a slanted upper edge.
<ins>Meaning:</ins> Represents an operation performed manually.
The manual operation symbol identifies work completed by a person rather than an automated system.
Examples include:
- Manually inspect a product.
- Assemble a package by hand.
- Review a paper application.
- Sign a printed document.
- Move materials to another location.
Manual input and manual operation are related but different. Manual input concerns entering information. Manual operation concerns performing a task.
When to use it: Use this symbol when a human performs an operation that is not carried out automatically by a machine or computer.
Delay Symbol
<ins>Shape:</ins> D-shaped symbol with one straight side and one curved side.
<ins>Meaning:</ins> Represents a waiting period or delay.
The delay symbol identifies a point where a process pauses before continuing.
Examples include:
- Wait for manager approval.
- Wait for a payment response.
- Pause until a scheduled time.
- Wait for a delivery.
- Allow a system timeout.
Delay symbols help businesses identify bottlenecks. If customers wait several days for approval, the diagram can make that delay visible.
When to use it: Use this shape when waiting time is an important part of the process.
Merge Symbol
<ins>Shape:</ins> Inverted triangle.
<ins>Meaning:</ins> Combines multiple incoming process paths into one.
A merge symbol shows where separate paths come together. For example, an order might reach the shipping stage after either online payment or approved cash-on-delivery processing.
A merge is not the same as a decision. A decision splits a path based on a condition, while a merge brings paths together.
When to use it: Use it when separate branches return to a shared sequence.
Data File Symbol
<ins>Shape:</ins> Depends on the flowchart notation or storage type.
<ins>Meaning:</ins> Represents information stored in a file.
A data file symbol identifies information that a process saves or retrieves.
Examples include:
- Customer records.
- Spreadsheet files.
- Text documents.
- Data backups.
- Report files.
Use a storage symbol when the saved information matters to the process. If the system creates a report, a document symbol may be more appropriate.
When to use it: Use a data file or stored-data symbol when a process interacts with information saved for later use.
Online Storage Symbol
<ins>Shape:</ins> Varies by notation; a database cylinder is common for structured data storage.
<ins>Meaning:</ins> Represents information stored in an accessible digital location.
Online or directly accessible storage can include databases and network-based data repositories.
For example, an online shopping system may retrieve a customer’s address from a database before processing an order.
Be careful not to treat every storage symbol as identical. Some flowchart conventions distinguish between a general data store, a database, and storage that uses a particular access method.
When to use it: Use an appropriate storage symbol when a process reads from or writes to a database or another digital storage location.
Display Symbol
<ins>Shape:</ins> Screen-like shape, often with an angled side and curved edge.
<ins>Meaning:</ins> Represents information presented on a display.
The display symbol shows that a system presents information visually to a user.
Examples include:
- Account screen.
- Error message.
- Payment confirmation.
- Search results.
- Dashboard information.
A display symbol is useful when the screen output matters to the process. For a simple data output, a standard input/output parallelogram may be sufficient.
When to use it: Use the display shape when a screen or visual interface is an important part of the workflow.
Flowchart Symbols Cheat Sheet: Quick Reference Chart
The following flowchart symbols chart with names gives you a quick way to identify the most common shapes.
| Flowchart symbol | Shape | Meaning | Example |
| Terminator | Oval | Start or end | Start process |
| Process | Rectangle | Action or operation | Calculate total |
| Decision | Diamond | Conditional branch | Payment approved? |
| Input/output | Parallelogram | Data entering or leaving | Enter username |
| Flowline | Arrow | Direction of flow | Move to next step |
| On-page connector | Circle | Same-page connection | Continue at A |
| Off-page connector | Pentagon | Another-page connection | See page 2 |
| Predefined process | Double-lined rectangle | Subprocess | Verify customer |
| Document | Wavy-bottom rectangle | One document | Create invoice |
| Multiple documents | Stacked document shapes | Document collection | Generate reports |
| Preparation | Hexagon | Setup or initialization | Set counter to zero |
| Manual input | Slanted-top quadrilateral | Manual data entry | Type password |
| Manual operation | Trapezoid | Human-performed task | Inspect product |
| Delay | D-shaped | Waiting period | Wait for approval |
| Merge | Inverted triangle | Combines paths | Join order routes |
| Data storage | Storage-specific shape | Saved information | Customer database |
| Display | Screen-like shape | Visual output | Show result |
This chart covers the core symbols and several commonly used additional shapes. Advanced flowchart notation includes more specialized symbols for data processing, storage, and control.
Advanced Flowchart Symbols and Their Uses
Advanced symbols help explain more detailed processes, particularly in computing, engineering, data processing, and system design.
Not every software tool or diagramming convention uses every advanced shape. Some symbols come from specialized information-processing notation, so check the symbol key when reading an unfamiliar diagram.
OR Symbol
Meaning: Represents an OR condition in a process.
An OR symbol indicates that one or more alternative incoming conditions can allow a process to continue, depending on the notation being used.
For example, a customer may verify an account through an email code or an approved alternative method.
Use an OR symbol when the logical relationship between different paths matters.
Summing Junction Symbol
Meaning: Represents a junction where multiple incoming paths must be considered together.
In some flowchart conventions, a summing junction represents an AND-style relationship. The process continues only after the required incoming paths have reached the junction.
For example, a product may need both a quality inspection and a safety inspection before approval.
The exact convention should be made clear in the diagram because different systems may use different names and graphical forms.
Loop Limit Symbol
Meaning: Marks a boundary or control point associated with a repeating process.
Loops allow a process to repeat until a condition is satisfied or a limit is reached.
For example, a system may allow three password attempts. A loop limit can help document where the repeated process stops.
Iteration Symbol
Meaning: Represents a repeated process or operation.
An iteration symbol is useful when a task must run more than once.
Examples include:
- Checking each item in an inventory list.
- Processing multiple customer records.
- Repeating a calculation.
- Reviewing each application in a queue.
In many everyday diagrams, a return arrow and a decision diamond are enough to represent a loop. Specialized symbols are useful when the chosen notation calls for them.
Parallel Mode Symbol
Meaning: Represents activities that can occur at the same time.
Parallel processing allows separate tasks to run independently or simultaneously.
For example, after receiving an order, a business might check stock availability while another system verifies the shipping address.
A parallel mode symbol helps explain that these tasks do not necessarily need to happen one after another.
Synchronization Bar
Meaning: Shows where parallel activities begin or join.
A synchronization bar is used in certain diagramming conventions to coordinate concurrent activities.
For example, a production process may require both assembly and inspection to finish before packaging begins.
This symbol helps readers understand when multiple paths must reach a shared point.
Internal Storage Symbol
Meaning: Represents information held in a computer’s internal memory.
Internal storage is different from long-term file or database storage. It can represent data temporarily held while a program runs.
Examples include:
- Temporary variables.
- Working memory.
- Values stored during calculations.
- Information used by an active program.
Collate Symbol
Meaning: Represents the arrangement or assembly of information into a particular order.
For example, a printing process may collate several pages into complete document sets.
A collate symbol can help explain document handling and data-processing operations.
Sort Symbol
Meaning: Represents arranging information according to a defined order.
Examples include:
- Sort customer names alphabetically.
- Arrange products by price.
- Order transactions by date.
- Sort records by identification number.
A sort operation is common in database processing, reporting, and inventory management.
Transfer Symbol
Meaning: Represents the movement of materials or information between process stages.
For example, a warehouse may transfer packaged products from the packing area to the shipping department.
Some specialized flowchart symbol sets use transfer-related shapes to distinguish movement from ordinary processing.
Magnetic Tape Storage Symbol
Meaning: Represents magnetic tape used for sequential data storage.
Magnetic tape was widely used in earlier computing systems for data storage, backups, and archival records. It remains relevant in certain modern enterprise backup and long-term archival environments.
Unlike random-access storage, traditional tape systems read records in sequence. Finding a particular record can require moving through earlier portions of the tape.
Sequential Access Storage Symbol
Meaning: Represents data storage accessed in a specific sequence.
Magnetic tape is a familiar example of sequential access storage.
This symbol is useful when the order of access matters to a data-processing operation.
Data Retrieval Symbol
Meaning: Represents retrieving previously stored information.
For example, an application may retrieve a customer’s saved address before preparing a shipping label.
A flowchart can show this as a database or data-store interaction, depending on the notation being used.
Data Symbol
Meaning: Represents data involved in a process.
The data symbol is often used as another name for the input/output parallelogram. It can represent information entering or leaving a system.
Process Convergence Symbol
Meaning: Represents separate process paths coming together.
Process convergence is useful in workflows where different activities must reach a common stage. For example, a sales order may move forward after payment verification and stock confirmation.
The exact symbol used for convergence depends on the diagramming convention.
Flowchart Symbols and Their Functions in Real World Examples
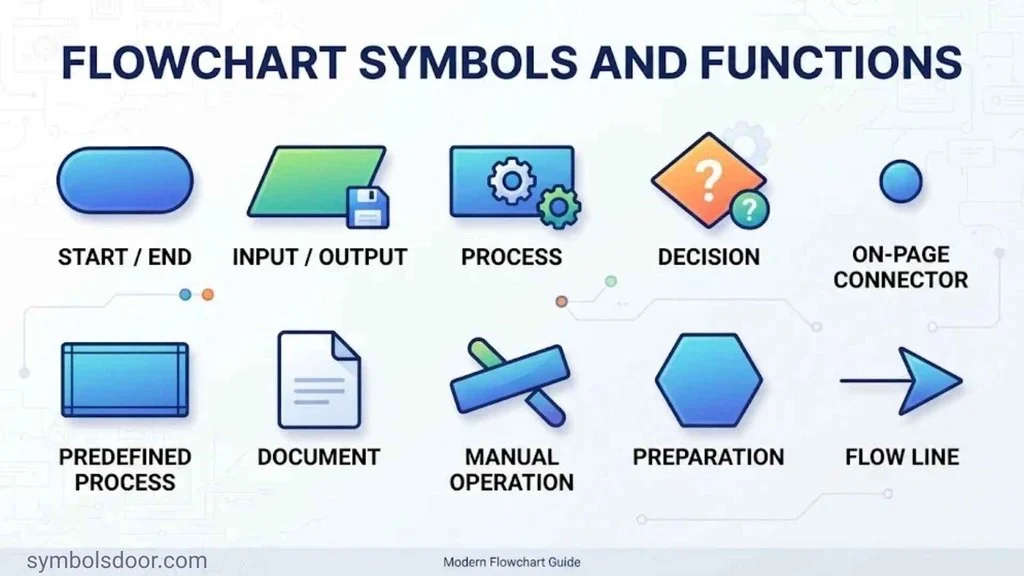
Understanding individual shapes is useful, but seeing them together makes their purpose clearer. The following examples show how basic symbols create complete process flow diagrams.
Login Process Flowchart
A login flowchart explains how a system checks a user’s credentials before granting access.
| Step | Symbol | Action |
| 1 | Terminator | Start |
| 2 | Input/output | Enter username and password |
| 3 | Process | Validate credentials |
| 4 | Decision | Are the credentials correct? |
| 5A | Process | Open account |
| 5B | Process | Display error message |
| 6 | Terminator | End |
The decision diamond creates two paths. A correct password leads to the account screen, while an incorrect password leads to an error message.
Online Shopping and Payment Flowchart
An online shopping workflow shows how a customer places an order and receives confirmation.
- Start: The customer begins shopping.
- Process: The customer selects a product.
- Process: The product is added to the cart.
- Input/output: The customer enters shipping details.
- Process: The payment system checks the transaction.
- Decision: Is the payment approved?
- Yes path: Confirm the order and prepare shipping.
- No path: Display a payment error or request another payment method.
- End: The transaction reaches its appropriate endpoint.
This example uses terminators, process rectangles, input/output shapes, and a decision diamond.
Employee Leave Approval Flowchart
A leave approval process can involve both manual and automated steps.
| Step | Symbol | Description |
| Start | Terminator | Employee begins the request |
| Input | Manual input | Employee enters leave dates |
| Process | Rectangle | System records the request |
| Decision | Diamond | Is the request approved? |
| Yes | Process | Update leave balance |
| No | Process | Notify employee |
| End | Terminator | Complete the request |
A business can expand this flowchart with a document symbol for the leave application and a delay symbol for waiting on manager approval.
Data Processing Flowchart
A data-processing diagram shows how information moves through a system.
A simple sequence might look like this:
Start → Receive Data → Validate Data → Process Records → Store Results → Retrieve Results → Display Output → End
Each step has a distinct role:
- Input/output shows where information enters.
- Process rectangles show validation and calculations.
- A decision diamond can identify invalid records.
- A storage symbol shows where information is saved.
- A display symbol shows the final result.
This type of diagram is useful in software development, reporting, and database operations.
Manufacturing Process Flowchart
A manufacturing flowchart can document how a product moves through production and quality control.
| Stage | Flowchart symbol | Activity |
| Start | Terminator | Begin production |
| Process | Rectangle | Receive materials |
| Process | Rectangle | Assemble product |
| Decision | Diamond | Does the product pass inspection? |
| Yes | Process | Package product |
| No | Process | Send product for rework |
| End | Terminator | Complete production |
The decision point makes quality control visible. It also shows what happens when a product fails inspection.
Different Types of Flowcharts and Their Applications
Flowcharts can represent many kinds of processes. The right format depends on what you want readers to understand.
Process Flowcharts
A process flowchart shows the steps involved in completing a task or operation.
Businesses use these diagrams to document procedures such as:
- Customer order processing.
- Invoice approval.
- Product returns.
- Employee onboarding.
- Quality inspections.
Process flowcharts help teams understand how work moves from one stage to another.
Workflow Diagrams
A workflow diagram explains how tasks move between people, departments, or systems.
For example, an expense approval workflow may begin with an employee submitting a claim. A manager reviews it, the finance department checks the details, and the payment team processes the approved amount.
Swimlanes can make these diagrams easier to understand by separating responsibilities.
Data Flowcharts
A data flowchart focuses on how information enters, moves through, and leaves a process.
It may show:
- Data entry.
- Information processing.
- Database storage.
- Data retrieval.
- Report generation.
A formal data flow diagram (DFD) is related but not identical to a flowchart. DFDs focus on data movement between processes, external entities, and data stores. Traditional flowcharts focus more broadly on the sequence and logic of activities.
System Flowcharts
A system flowchart explains how a computer system or information system works.
It can show how input devices, processing activities, databases, files, and output devices interact.
For example, a payroll system diagram might show employee information entering a system, salary calculations taking place, and payment reports being generated.
Program and Algorithm Flowcharts
A program flowchart explains the logic behind a computer program. It uses process shapes, decision diamonds, input/output symbols, and arrows to represent instructions.
An algorithm flowchart can describe:
- Calculating an average.
- Checking whether a number is even or odd.
- Finding the largest value.
- Validating a password.
- Repeating a task until a condition is met.
These diagrams help developers plan program logic before writing code. They can also support algorithm documentation and troubleshooting.
Swimlane Flowcharts
A swimlane flowchart separates a process into lanes based on who performs each activity.
A lane may represent a person, team, department, or computer system.
For example, an online order workflow could include separate lanes for:
- Customer.
- Sales department.
- Payment system.
- Warehouse.
- Delivery company.
Swimlanes make handoffs and responsibilities easier to see. They are especially useful when several teams participate in one process.
Decision Flowcharts
A decision flowchart focuses on questions, conditions, and possible outcomes.
For example, a troubleshooting diagram might ask whether a device has power. A Yes answer leads to the next check, while a No answer directs the user to inspect the power supply.
These diagrams are useful for customer support, technical troubleshooting, and business approvals.
Where Are Flowchart Symbols Used?
Flowchart symbols appear in many industries because nearly every organization has processes that need to be explained, documented, or improved.
Business Process Mapping
Companies use flowcharts to understand how everyday work gets completed.
Common applications include:
- Sales procedures.
- Customer support.
- Invoice processing.
- Employee onboarding.
- Purchase approvals.
- Refund handling.
Business process mapping helps teams identify repeated work, unnecessary approvals, and unclear responsibilities.
Software Development
Developers use flowcharts to plan and document application behavior.
For example, a login diagram can show how the system checks a username, validates a password, and responds to incorrect information.
Flowcharts also support:
- Algorithm design.
- Program logic.
- Automated testing.
- Error handling.
- System documentation.
- User flow diagrams.
Industrial Engineering and Manufacturing
Manufacturers use process diagrams to document production activities and identify operational problems.
A diagram can show the movement of raw materials, assembly steps, inspection points, packaging, and shipping.
This makes it easier to identify bottlenecks, unnecessary movement, and delays.
Project Management
Project managers use workflow diagrams to explain task sequences and approval stages.
A project flowchart can show which activities must finish before another task begins. It can also identify decision points, dependencies, and team responsibilities.
Data Processing and Database Operations
Data teams use flowcharts to explain how information enters a system, gets validated, and moves into storage.
Examples include:
- Customer record management.
- Data validation.
- Database operations.
- Information retrieval.
- Data migration.
- Report generation.
- Data processing pipelines.
Logistics and Supply Chain Management
Logistics teams use flowcharts to document how products move through a supply chain.
A warehouse diagram may show receiving, inspection, inventory updates, picking, packing, and delivery.
These diagrams can help identify delays and improve operational efficiency.
History and Standards of Flowchart Symbols
Flowcharts developed from early efforts to study and improve how people performed work. Over time, engineers and computer scientists adopted visual notation to explain processes more consistently.
Frank and Lillian Gilbreth and the Early History of Flowcharts
Industrial engineers Frank Gilbreth and Lillian Gilbreth played an important role in the development of process charting.
In 1921, they presented their work on process charts to the American Society of Mechanical Engineers. Their presentation, Process Charts: First Steps in Finding the One Best Way to Do Work, helped establish visual process analysis as a practical tool for improving work methods.
Their work connected closely with time and motion studies, which examined how people performed tasks and how organizations could reduce unnecessary movements.
The early process charts helped engineers study work sequences, identify inefficiencies, and improve operations.
As computing developed, flowcharts became important tools for explaining program instructions and system operations.
ANSI Flowchart Symbols
The American National Standards Institute (ANSI) coordinates voluntary standards across many industries in the United States.
ANSI-related flowchart conventions helped establish recognizable graphical representations for process steps, decisions, inputs, outputs, and connections.
However, it is important to avoid treating every flowchart symbol set as one universal ANSI collection. Different standards and technical applications may use different symbols.
ISO 5807 Flowchart Standard
The International Organization for Standardization (ISO) publishes standards used across industries and countries.
One important reference is ISO 5807:1985, titled Information Processing — Documentation Symbols and Conventions for Data, Program and System Flowcharts, Program Network Charts and System Resources Charts.
It defines symbols and conventions for documenting information-processing systems and related diagrams.
ISO’s official record states that the standard was published in February 1985 and was reviewed and confirmed in 2019. The published edition therefore remains current according to the ISO catalog.
You can review its official description on the ISO 5807 standard page.
ANSI vs. ISO Flowchart Symbols
ANSI and ISO are both associated with standardized technical documentation, but they should not be treated as interchangeable labels for every shape.
| Area | ANSI-related conventions | ISO 5807 |
| Organization | American National Standards Institute | International Organization for Standardization |
| Main context | US standards and technical documentation | International information-processing documentation |
| Application | Depends on the relevant ANSI standard | Data, program, and system flowcharts, among other diagram types |
| Symbol usage | Depends on the applicable standard | Defines symbols and conventions for specified diagram types |
The best approach is to select a suitable notation and use it consistently throughout your diagram.
How to Read a Flowchart Diagram
Reading a flowchart becomes easier when you understand its starting point, shapes, arrows, and decision branches.
Follow these steps:
- Find the start symbol. Look for an oval or rounded rectangle labeled Start or Begin.
- Follow the arrows. Flowlines show which step comes next.
- Read the process rectangles. These contain actions, tasks, and operations.
- Look for decision diamonds. Identify the question or condition inside each diamond.
- Check branch labels. Follow labels such as Yes, No, True, False, Pass, or Fail.
- Recognize input and output. Parallelograms show where information enters or leaves the process.
- Follow connectors. Matching labels show where a separated section continues.
- Find the endpoint. Check where the process finishes.
Understanding Flowchart Direction
Most flowcharts use a top-to-bottom flow direction or a left-to-right flow direction.
Top-to-bottom layouts work well for processes with a clear vertical sequence. Left-to-right layouts can be useful for timelines and processes that move through several stages.
Choose one main direction and keep it consistent. If a process needs to move backward, use a clear return arrow rather than leaving readers to guess.
Understanding Decision Points
A decision diamond should contain a clear question or condition.
For example, consider the question “Is the application complete?”
- Yes: Send the application for approval.
- No: Return the application for missing information.
Each outgoing line should have a label. If a decision has three possible outcomes, label all three branches.
Understanding Connectors
Connectors help readers follow diagrams that contain separated sections.
An on-page connector leads to a matching point on the same page. An off-page connector directs readers to a different page or diagram.
Always use matching labels or references. A connector without a clear destination can make a flowchart confusing.
How to Create a Professional Flowchart
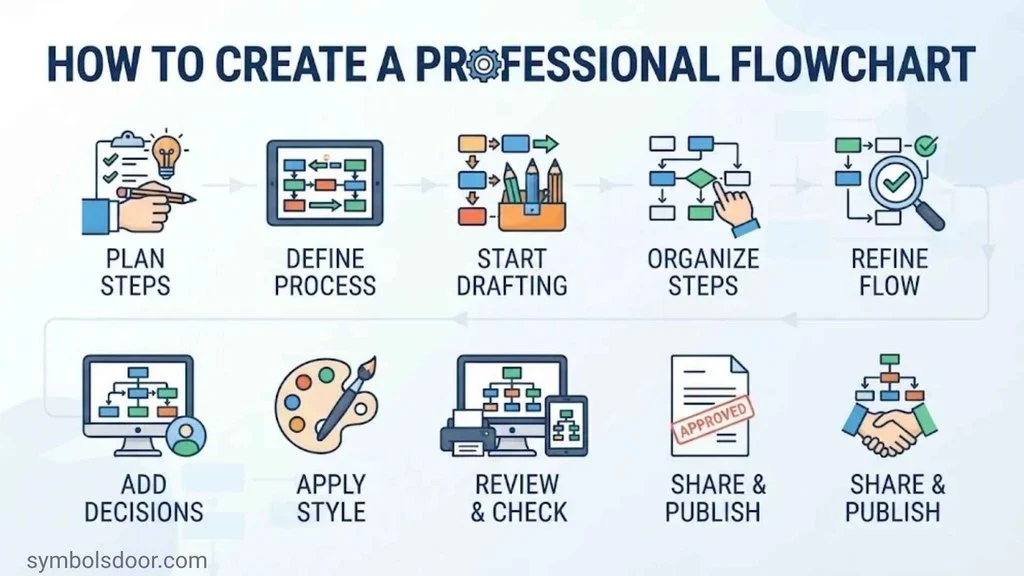
Creating a useful flowchart starts with understanding the process. You don’t need to add every available shape. Choose only the symbols that explain the process accurately.
Define the Process
First, decide what you want the diagram to explain.
Ask yourself:
- What process am I documenting?
- Where does it begin?
- Where does it end?
- Who performs the activities?
- Which systems are involved?
- What decisions change the process?
Defining the scope prevents the diagram from becoming too broad.
List the Process Steps
Write down the activities in the order they occur.
For an order process, the list might include:
- Receive customer order.
- Check product availability.
- Confirm payment.
- Prepare the package.
- Ship the order.
- Send confirmation.
Identify any decisions, documents, delays, or data-storage activities as well.
Choose the Correct Flowchart Shapes
Match each activity to the symbol that describes it.
| What happens? | Symbol to use |
| The process begins or ends | Terminator |
| Someone performs an action | Process |
| A condition changes the next step | Decision |
| Data enters or leaves | Input/output |
| A document is created or used | Document |
| Information is saved | Data storage |
| A person enters information | Manual input |
| A task is performed manually | Manual operation |
| The process must wait | Delay |
| The flow continues elsewhere | Connector |
Connect the Shapes
Use arrows to connect the symbols in the correct sequence.
Make sure every decision branch has a clear label. Check that connectors lead to matching destinations and that the process doesn’t contain unexplained gaps.
Review and Test the Flowchart
Read the diagram from start to finish. Follow every possible route, not just the most common one.
Check for:
- Missing actions.
- Unlabeled decision branches.
- Disconnected shapes.
- Incorrect arrow directions.
- Unclear endpoints.
- Repeated steps.
- Unnecessary complexity.
If another person can follow the process without asking you to explain every shape, your diagram is probably clear enough to use.
Flowchart Design Best Practices and Common Mistakes
A professional flowchart should make information easier to understand. A complicated diagram with too many shapes can create more confusion than it removes.
Best Practices for Clear Flowcharts
Follow these recommendations when designing your diagram:
- Use consistent symbols: Don’t change a shape’s meaning halfway through a diagram.
- Keep labels short: Use clear action phrases rather than long paragraphs.
- Choose one main direction: Prefer top-to-bottom or left-to-right layouts.
- Label decision branches: Make Yes/No or other outcomes easy to identify.
- Use connectors carefully: Reduce long lines and unnecessary crossings.
- Group related activities: Keep similar steps close together.
- Use subprocesses: Move lengthy procedures into separate diagrams when appropriate.
- Include endpoints: Make sure every process path has a clear conclusion.
- Use meaningful titles: Explain what the flowchart documents.
Common Flowchart Mistakes to Avoid
| Mistake | Why it causes problems | Better approach |
| Using a rectangle for every activity | Hides the difference between actions and decisions | Match each shape to its function |
| Leaving decision paths unlabeled | Readers cannot identify the outcomes | Label every branch |
| Connecting shapes without arrows | Makes the sequence unclear | Use directional flowlines |
| Crossing too many lines | Makes the diagram difficult to follow | Rearrange shapes or use connectors |
| Adding too much detail | Creates an overcrowded diagram | Divide the process into subprocesses |
| Forgetting an endpoint | Leaves the process incomplete | Include a clear ending |
| Using unexplained symbols | Confuses people unfamiliar with the notation | Add a symbol key or legend |
| Mixing different conventions | Creates inconsistent meanings | Follow one notation throughout |
How to Make Complex Flowcharts Easier to Understand
Large processes often involve many departments, decisions, and systems. Trying to fit everything into one diagram can make it difficult to read.
Instead, break the process into smaller sections.
For example, an online order system could have separate diagrams for:
- Customer registration.
- Product selection.
- Payment processing.
- Inventory management.
- Shipping and delivery.
Use predefined process symbols to connect these diagrams. If several departments share responsibility, consider using swimlanes.
The goal is simple: show enough detail to explain the process without overwhelming the reader.
Best Flowchart Software and Online Flowchart Makers
You can create a flowchart using paper and a pencil, but diagramming software makes larger projects easier to manage.
A good flowchart maker should provide familiar shapes, connectors, templates, and editing tools.
What to Look for in Flowchart Software
Consider these features before choosing a tool:
- A standard shape library containing common flowchart symbols.
- Drag-and-drop editing for arranging shapes.
- Connectors that attach to diagram shapes.
- Flowchart templates and examples.
- Custom flowchart labels and formatting.
- Export options for sharing diagrams.
- Collaboration tools for team projects.
- AI-assisted diagram creation, if it fits your workflow.
Not every project needs advanced features. A simple diagram may require only a few shapes and arrows.
MockFlow Flowchart Maker
MockFlow provides online tools for visual planning and diagram creation.
Its flowchart capabilities can help users arrange shapes, connect process steps, and build workflow diagrams. It may be useful for teams that want to plan a process visually without drawing every element from scratch.
When evaluating the MockFlow Flowchart Maker, check whether its current features, export options, and collaboration tools match your project requirements.
Other Flowchart Creation Tools
You can also explore these diagramming applications:
| Tool | Main use |
| Microsoft Visio | Professional diagrams and business process documentation |
| diagrams.net | Free online diagram creation and flowcharts |
| Lucidchart | Collaborative diagrams and process mapping |
| SmartDraw | Flowcharts, business diagrams, and templates |
Compare the tools based on ease of use, available symbols, collaboration, and file formats. Features and pricing can change, so check each provider’s current information before choosing.
Frequently Asked Questions About Flowchart Symbols
What Are the Most Common Flowchart Symbols?
The most common flowchart symbols are the terminator, process rectangle, decision diamond, input/output parallelogram, and flowline arrow. Many diagrams also use connectors, document symbols, and data-storage shapes.
These symbols are enough to explain most basic workflows, algorithms, and business processes.
What Does an Oval Represent in a Flowchart?
An oval represents the beginning or end of a process. It is called a terminator symbol or terminal symbol.
You may see it labeled Start, Begin, End, or Finish.
What Does a Rectangle Mean in a Flowchart?
A rectangle represents a process, action, or operation. Examples include calculating a value, checking information, updating a record, or preparing an order.
What Does a Diamond Represent in a Flowchart?
A diamond represents a decision point. It contains a question or condition that determines which path the process follows.
For example, a payment decision may have Approved and Declined branches.
What Does a Parallelogram Mean in a Flowchart?
A parallelogram represents input or output. It shows information entering a process or results leaving it.
Entering a password and displaying a confirmation message are common examples.
What Does an Arrow Mean in a Flowchart?
An arrow represents the direction and sequence of a process. It connects shapes and shows which activity happens next.
What Is the Difference Between an On-Page and Off-Page Connector?
An on-page connector uses a small circle to connect separated sections on the same page. An off-page connector usually uses a pentagon-shaped symbol to show that the process continues on another page.
Both symbols help prevent long, confusing flowlines.
What Does a Predefined Process Symbol Represent?
A predefined process symbol represents a subprocess documented separately. It allows a flowchart to reference a detailed procedure without showing every internal action.
What Is the Difference Between Manual Input and Manual Operation?
Manual input represents information entered by a person, such as typing a password into a form.
Manual operation represents work performed by a person, such as inspecting a product or assembling an item by hand.
What Does a Delay Symbol Mean in a Flowchart?
A delay symbol represents a waiting period or pause. Examples include waiting for approval, a payment response, a scheduled time, or a delivery.
What Is the Difference Between a Merge and a Decision Symbol?
A decision diamond splits a process into different paths based on a condition. A merge brings separate paths together into one sequence.
A decision separates routes; a merge reunites them.
How Many Symbols Are Used in a Flowchart?
There is no single fixed number of symbols used in every flowchart. Basic diagrams often rely on five core symbols, while specialized diagrams use additional shapes for documents, storage, manual operations, delays, and data processing.
The number depends on the process and the notation being followed.
Are Flowchart Symbols Standardized?
Many common flowchart symbols have widely recognized meanings. Standards such as ISO 5807 define symbols and conventions for information-processing documentation.
However, specialized symbols and software libraries can differ. Always use a consistent notation and provide a legend when necessary.
What Is ISO 5807?
ISO 5807:1985 is an international standard for symbols and conventions used in data, program, and system flowcharts, as well as certain related information-processing diagrams.
It was published in February 1985 and reviewed and confirmed in 2019.
Which Direction Should a Flowchart Follow?
Most flowcharts follow a top-to-bottom or left-to-right direction. Either approach can work, provided the diagram uses a consistent layout and clear arrowheads.
Can I Create a Flowchart Without Special Software?
Yes. You can draw a flowchart by hand using paper, a pencil, and a ruler. You can also use presentation software or an online diagramming tool.
For a small process, basic shapes and arrows are usually enough.
Conclusion: Understanding Flowchart Symbols and Their Meanings
Flowchart symbols turn complicated procedures into diagrams that people can follow. Each shape has a purpose: an oval marks the start or end, a rectangle represents an action, a diamond identifies a decision, and a parallelogram shows input or output.
Advanced symbols add more detail when a process involves documents, storage, manual operations, delays, or parallel activities.
You don’t need to use every available shape to create a useful diagram. Start with the basic symbols, connect them with clear arrows, and label each decision path. Add specialized shapes only when they make the process easier to understand.
Whether you’re documenting a business workflow, planning an algorithm, designing software, or improving a manufacturing process, choosing the right flowchart shapes and their meanings will help you communicate the process clearly.

Hi, I’m Asher Monroe, a writer who believes that meaningful words have the power to inspire change and bring people closer to their dreams. I have always been fascinated by the beauty of quotes and the way a simple message can provide motivation, hope, and comfort.
I enjoy creating content around inspirational quotes, life lessons, success stories, and positive thoughts that help readers find encouragement in their everyday lives. My goal is to share words that connect with people and remind them of their inner strength.
Through my writing, I explore the ideas of personal growth, confidence, and the importance of staying inspired through every chapter of life.
I am the author of Words That Move the Soul and The Path of Endless Inspiration, two books focused on the power of wisdom, positivity, and meaningful thoughts.
 Sienna Brooks
 Rowan Sinclair Rowan Sinclair